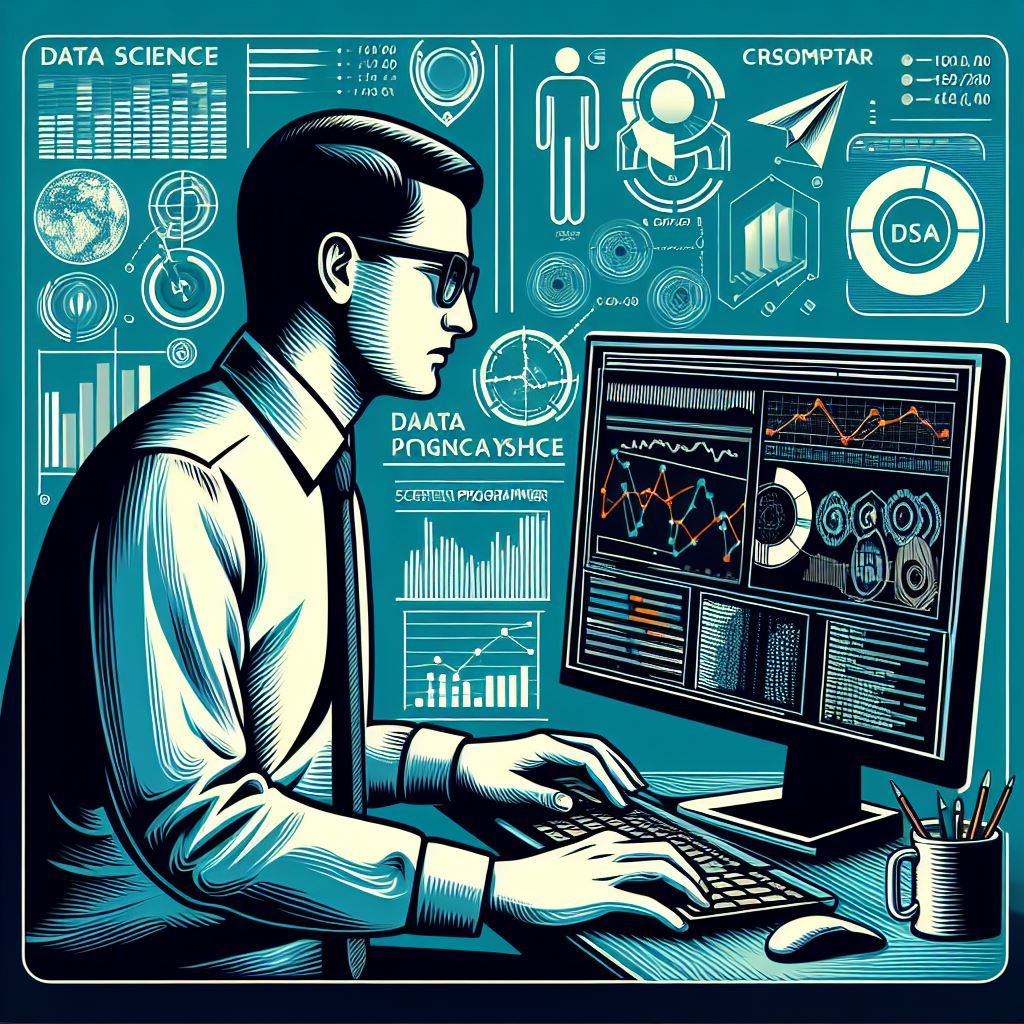
In today’s data-driven world, the ability to extract valuable insights from complex datasets is more important than ever. Data science plays a crucial role in this process, enabling businesses to make informed decisions based on patterns and trends hidden within raw data. One of the most powerful techniques for uncovering these insights is data visualization. By transforming raw data into interactive, easy-to-understand visual formats, data science visualization helps professionals communicate complex findings to both technical and non-technical audiences.
Data visualization is more than just the creation of charts or graphs. It is an essential tool for exploratory data analysis (EDA) and a key step in understanding the story behind the numbers. Through data visualization, analysts can identify outliers, trends, correlations, and even potential issues within the data before diving deeper into more advanced modeling techniques. This process not only aids in making sense of data but also streamlines decision-making processes across industries.
The Importance of Data Science Visualization
Visualization bridges the gap between complex quantitative data and human understanding. While statistical analysis and machine learning models can uncover trends, visualizations make these trends accessible to decision-makers, stakeholders, and other team members. For example, heat maps, scatter plots, bar charts, and histograms can reveal important patterns in data that might otherwise go unnoticed. Tools like Tableau, Power BI, and Python libraries such as Matplotlib and Seaborn empower data scientists to create visually compelling insights from large datasets, enhancing the storytelling aspect of data.
Moreover, data visualization enhances collaboration within teams. It allows everyone, regardless of technical background, to understand key findings quickly and easily. With intuitive visual aids, decision-makers can see the impact of different variables on business outcomes, aiding in more effective strategic planning. For example, a business might use a dashboard showing sales trends over time to pinpoint seasonal fluctuations or identify which products are underperforming.
Key Visualization Techniques in Data Science
Bar and Line Charts: These are some of the most commonly used tools in data science visualization. Bar charts are great for comparing categories, while line charts excel at showing trends over time. For instance, a sales team might use a line chart to track monthly sales performance or a bar chart to compare the sales figures of different products.
Heatmaps: Heatmaps represent data values in matrix format, with colors indicating the intensity of the data. They are useful for showing correlations between different variables or comparing multiple datasets simultaneously.
Scatter Plots: Scatter plots are a powerful way to show relationships between two continuous variables. Data scientists often use scatter plots to detect correlations and identify outliers that may skew analysis.
Pie Charts: Though often criticized for being misleading in some cases, pie charts can still be useful in showing proportions. They are typically used when you want to illustrate the relative size of categories within a dataset.
Dashboards: Dashboards are interactive platforms that allow users to filter and explore data in real-time. Using data from multiple sources, dashboards aggregate information into one easy-to-understand view, which helps businesses quickly identify trends and anomalies.
The Future of Data Science Visualization
As the volume of data continues to grow, the future of data visualization lies in automation and integration with advanced analytics. Real-time data visualizations, predictive modeling, and AI-powered dashboards are making it easier than ever to make sense of massive datasets. Moreover, augmented reality (AR) and virtual reality (VR) are beginning to play a role in data visualization, offering immersive ways to interact with data on a deeper level.
In the coming years, we can expect to see more innovations in the field of data science visualization. With tools becoming increasingly sophisticated and accessible, even those with limited technical expertise will be able to leverage data science to make data-driven decisions, ensuring that companies and individuals alike stay competitive in an ever-evolving landscape.
5
